
Um inventário verificado mostra que a Fazenda São Pedro da Mantiqueira retira mais gases de efeito estufa da atmosfera do que emite. E abre uma pergunta maior sobre a régua que o mundo usa para medir o carbono guardado no solo.
Toda fazenda emite gases de efeito estufa. O trator queima diesel, o rebanho digere capim e libera metano, o adubo nitrogenado devolve óxido nitroso ao ar. A pergunta que a ciência do clima faz não é se uma propriedade emite — é se, no fim das contas, ela devolve mais carbono à atmosfera do que retira dela. Na Fazenda São Pedro da Mantiqueira, em Pindamonhangaba (SP), a resposta contraria a intuição: a conta fecha no negativo. A propriedade sequestra mais do que emite.
Este artigo é organizado em três partes. Primeiro, o inventário oficial — o que a fazenda emite e remove, calculado pela SCM e auditado pela KPMG. Depois, o carbono efêmero: o que é e como ele entra na leitura do fluxo de gases da propriedade. Por fim, uma reflexão sobre a regra dos 30 centímetros de profundidade — de onde ela vem e o que encontramos quando fomos mais fundo.| Método | Balanço de GEE (tCO₂e) |
|---|---|
| Tier 2 · fatores nacionais | −2.015 |
| Tier 3 · fatores locais | −9.041 |
| Tier 3 Métrico · medição direta | −48.648 |
Balanço de GEE da Fazenda São Pedro da Mantiqueira, por método de cálculo. Valores negativos indicam sequestro líquido. Safra 2023/2024, verificado pela KPMG.


Decomposição do balanço de GEE por método, em tCO₂e. Barras positivas = emissões; negativas = remoções. Análise SCM, verificação KPMG.
Valores em tCO₂e, safra 2023/2024.
Vale a distinção: o carbono efêmero é um fluxo anual de carbono temporário — não faz parte do balanço de GEE verificado da Parte 1, e não deve ser lido como sequestro permanente. Ele é apresentado à parte justamente para deixar claro o que é medição de estoque e o que é leitura de fluxo. Uma observação sobre o alcance dessa conta — e ela reforça o caráter conservador do número. Entraram no carbono efêmero apenas duas coisas: o que vira produto e deixa a fazenda (o grão de soja e a massa corporal do boi) e o que se humifica no solo, tendendo a se tornar carbono de duração muito longa. Ficou de fora todo o carbono retido nas reservas de alimento estocadas na própria fazenda — grão de milho, silagem, sorgo e snaplage —, que podem permanecer armazenadas por até dois anos como estratégia de segurança alimentar do rebanho, independentemente do clima. Ou seja: o fluxo de carbono temporário efetivamente manejado na propriedade é maior do que o contabilizado aqui.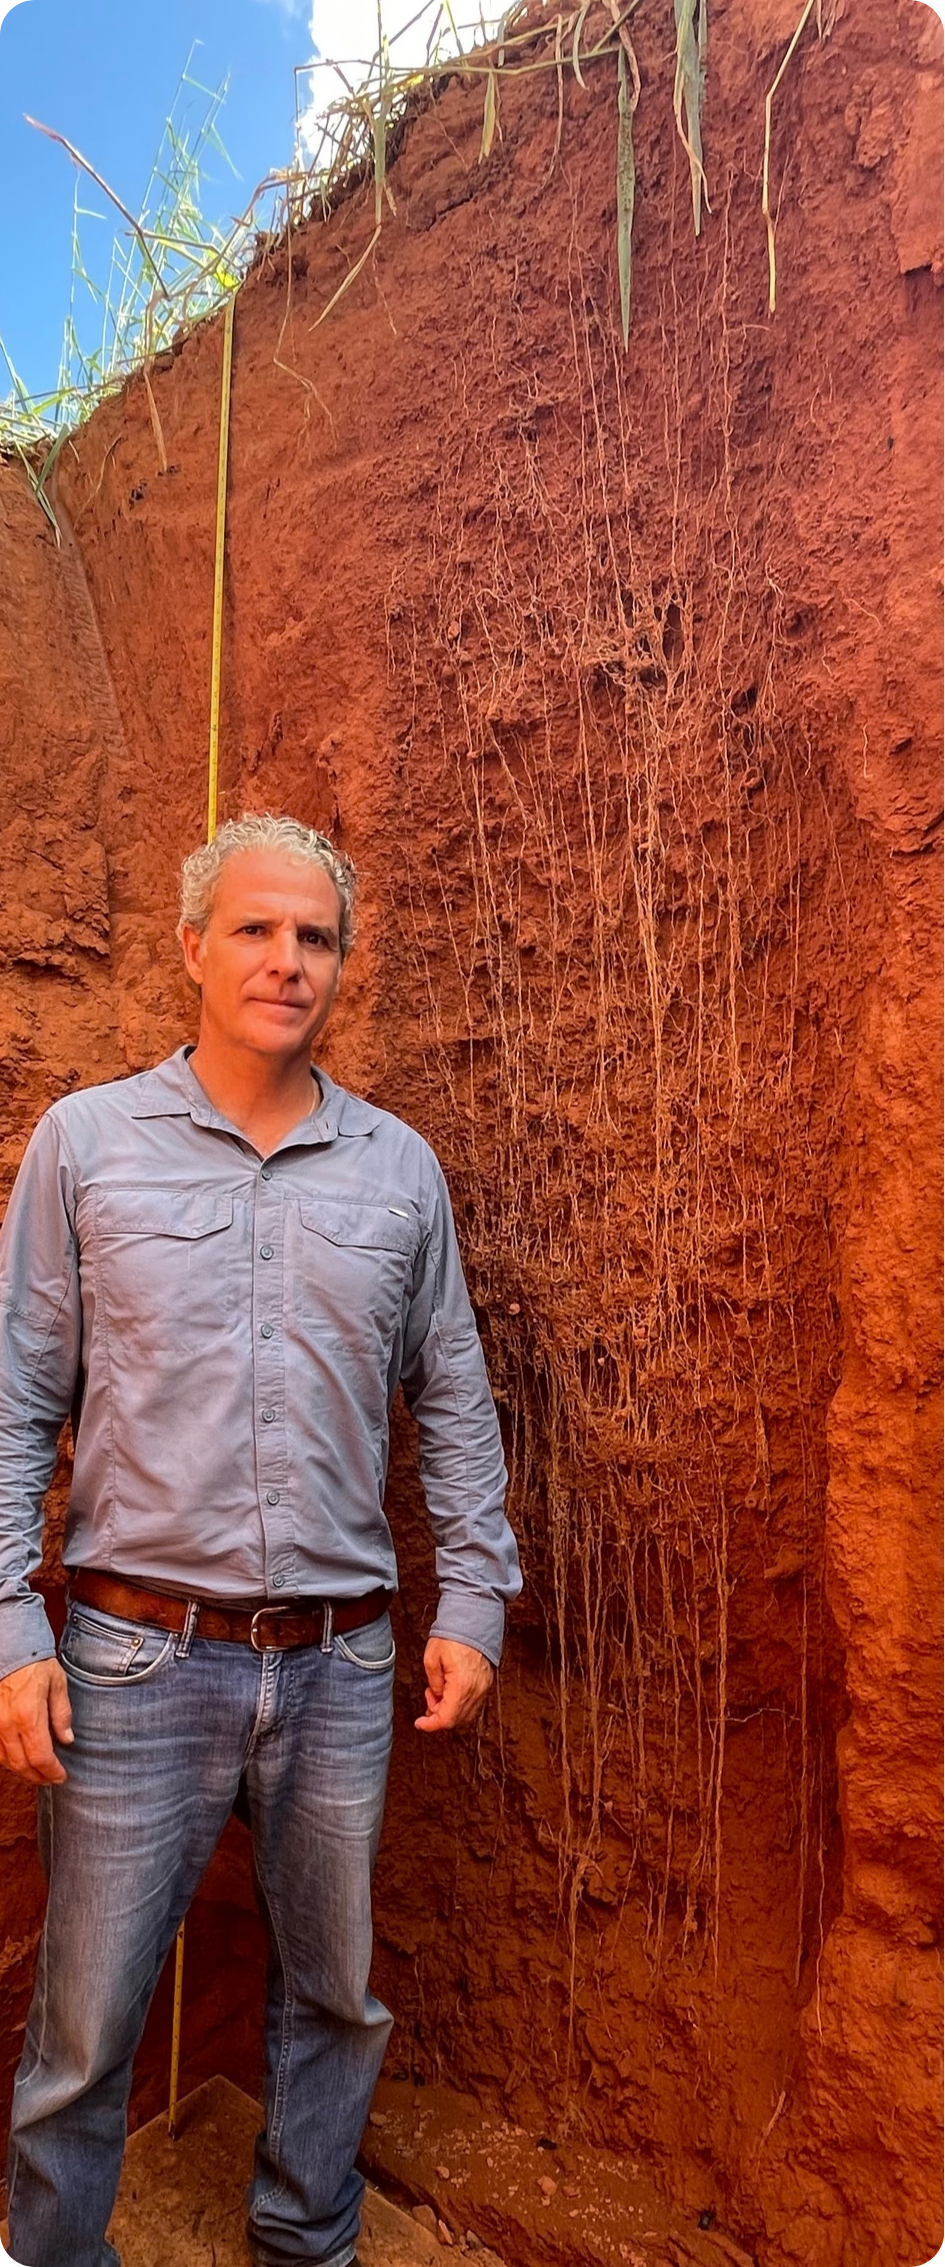
Trincheira aberta na Fazenda Roncador, município de Querência/MT: raízes vivas descem abaixo de 2 metros e o solo escurece gradualmente em profundidade — matéria orgânica se acumulando e carbono descendo pelo perfil, bem abaixo da régua dos 30 cm. Foto e observação do autor.
Falo também da experiência de quem cava. Todo ano eu entro em trincheiras na fazenda e vejo, com os próprios olhos, raízes vivas passando de dois metros de profundidade. Vejo a terra escurecer de cima para baixo, gradualmente — o que me parece matéria orgânica se acumulando e carbono descendo pelo perfil. Medir é rotina para mim desde os 14 anos, e o que a trincheira mostra é difícil de ignorar: há vida e carbono muito abaixo da linha onde costumamos parar de contar.| Faixa de profundidade | Estoque (tCO₂eq/ha) |
|---|---|
| 0 a 30 cm — o que o inventário conta | 267,08 |
| 30 a 200 cm — abaixo da régua padrão | 330,67 |
| 0 a 200 cm — perfil completo medido | 597,75 |
Estoque de carbono no solo por faixa de profundidade — Talhão 20B, Fazenda São Pedro da Mantiqueira. Medição direta (CHN). Estes valores são estoque de carbono por área (tCO₂eq/ha), uma grandeza distinta do balanço anual de fluxo (tCO₂e) apresentado nas Partes 1 e 2.
Nesse talhão, a camada entre 30 cm e 2 metros guarda 330,67 tCO₂eq/ha — mais do que os 267,08 dos primeiros 30 centímetros. Ou seja: a régua padrão enxergaria pouco menos da metade do carbono presente no perfil medido. O que os números levantam é uma pergunta legítima: se há tanto carbono abaixo da linha que costumamos medir, quanto do papel do solo no clima pode estar ficando fora da conta? Confirmar se esse carbono profundo também está aumentando sob bom manejo é o próximo passo da investigação.Reflexão de Pelerson Penido Dalla Vecchia · Grupo Roncador. Os trabalhos técnicos — retirada das amostras e compilação dos resultados das análises CHN — foram conduzidos pela SCM, e a verificação do balanço, pela KPMG. A leitura e as hipóteses desta parte são de responsabilidade do autor.
Inventário de gases de efeito estufa da Agropecuária São Pedro da Mantiqueira Ltda. (Grupo Roncador), safra 2023/2024, elaborado segundo o GHG Protocol Agropecuário, considerando os gases CO₂, CH₄ e N₂O convertidos em CO₂-equivalente pelos potenciais de aquecimento global do IPCC (AR5). O carbono do solo foi calculado por três abordagens (Tier 2, Tier 3 e Tier 3 Métrico), esta última por análise laboratorial CHN de amostras de campo. Análise técnica conduzida pela SCM; verificação independente do balanço pela KPMG. O balanço de GEE é expresso em tCO₂e (fluxo anual); os estoques de carbono por profundidade, em tCO₂eq/ha. O carbono efêmero representa fluxo anual de carbono temporário, não estoque permanente.
A fração de carbono efêmero retida na pecuária foi estimada a partir de um balanço de massa de carbono do rebanho (carbono ingerido particionado entre respiração, metano, fezes, urina e tecido corporal). Esse balanço apoia-se em NASEM — Nutrient Requirements of Beef Cattle (2016) e Dairy Cattle (2021); IPCC (2006) para metano entérico; o sistema CNCPS (Tedeschi, Fox & Tylutki) para partição de nutrientes; Johnson & Johnson (1995) para emissão de metano; e trabalhos de Ungerfeld sobre fermentação ruminal. As frações de partição entre compartimentos são calibradas para o sistema específico. O balanço detalhado do rebanho é objeto de um artigo próprio, à parte deste.
Full English translation of the article and technical inventory note below.
A verified inventory shows that São Pedro da Mantiqueira Farm removes more greenhouse gases from the atmosphere than it emits. And it opens a larger question about the yardstick the world uses to measure the carbon stored in soil.
Every farm emits greenhouse gases. The tractor burns diesel, the herd digests grass and releases methane, nitrogen fertilizer returns nitrous oxide to the air. The question that climate science asks is not whether a property emits — it is whether, in the end, it returns more carbon to the atmosphere than it removes from it. At São Pedro da Mantiqueira Farm, in Pindamonhangaba (SP), the answer defies intuition: the account closes in the negative. The property sequesters more than it emits.
This article is organized in three parts. First, the official inventory — what the farm emits and removes, calculated by SCM and audited by KPMG. Then, ephemeral carbon: what it is and how it enters the reading of the property’s gas flows. Finally, a reflection on the 30-centimeter depth rule — where it comes from and what we found when we went deeper.
Picture a scale. On one side, everything the farm emits: fuel, cattle fermentation, fertilizers, electricity. On the other, everything it pulls from the air and keeps — above all the carbon that plant roots push into the soil, where it can remain stored for decades. The GHG balance is the difference between the two pans.
When emissions exceed removals, the number is positive: the farm is a source. When removals exceed emissions, the number is negative — and the property works as a sink, a drain that helps clean the atmosphere. This balance was calculated by SCM following the GHG Protocol Agricultural Guidance and independently verified by KPMG.
Measuring emissions is relatively simple — you count the diesel, the herd, the fertilizer. Measuring soil carbon removal is harder, and that is where the so-called IPCC tiers (levels) come in — the UN’s climate science panel. Each tier is a yardstick of increasing precision:
Tier 2 — national factors. Uses standardized removal factors, adjusted to Brazil’s biome and conditions. It is the most conservative approach: it applies table values, without measuring the soil of that specific farm.
Tier 3 — local factors. Replaces the table with parameters calibrated for the region and the property, with detailed modeling of the carbon stock. It better captures the real effect of soil management.
Tier 3 Metric — direct measurement. The gold standard: instead of any estimated factor, carbon is physically measured in soil samples collected in the field, through laboratory analysis (CHN). It is the most faithful picture of what is actually in the ground.
The pattern repeats: the more the data comes from the farm’s own measurement, and the less from generic factors, the greater the recognized sequestration. The parameters in the standard tables are conservative and cannot take as a reference the Roncador Integrated Regenerative System — which, because it has a positive impact on the ecosystem, ends up capturing more carbon in the soil than expected under conventional management.
| Method | GHG Balance (tCO₂e) |
|---|---|
| Tier 2 · national factors | −2,015 |
| Tier 3 · local factors | −9,041 |
| Tier 3 Metric · direct measurement | −48,648 |
GHG balance of São Pedro da Mantiqueira Farm, by calculation method. Negative values indicate net sequestration. 2023/2024 crop year, verified by KPMG.
The charts below break down each balance bar by bar: emissions (on the left, in shades of orange), soil and biomass removals (in green, below the line) and the resulting GHG balance.
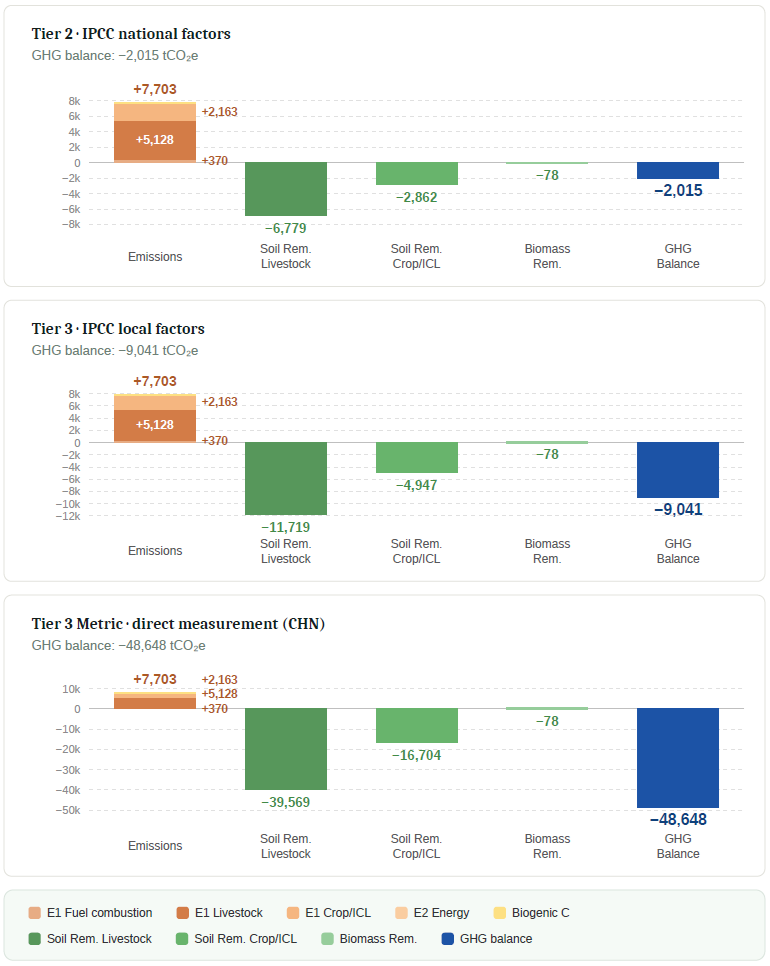
Breakdown of the GHG balance by method, in tCO₂e. Positive bars = emissions; negative bars = removals. SCM analysis, KPMG verification.
So far we have looked at the stock that stays. But there is a second, complementary view: the flow of carbon that passes through the farm over a year — the carbon that plants fix and that, in large part, returns to the atmosphere relatively quickly. This is what is called ephemeral carbon. It is not a permanent stock; it is a snapshot of how much carbon the property moves and temporarily retains each crop year.
Because it is temporary, this carbon must be accounted for rigorously: only what actually becomes a real temporary stock is counted, and the rest is discounted — what is breathed back by microorganisms, by the animal itself, or what already appears elsewhere in the balance (such as methane). There are two sources:
In livestock, the reasoning is as follows: of each portion of carbon the animal ingests, most is breathed back or becomes methane (already accounted for separately). Only a fraction — what becomes tissue in the animal, the biomass of soil microorganisms and the portion of manure that actually stabilizes — remains as stored carbon. It is this fraction, and only this one, that enters the calculation.
The size of this flow becomes clear when we place it side by side with the farm’s emissions. The ephemeral carbon fixed in a single year — in grain and biomass alone — is of the same order of magnitude as the direct and energy emissions of the same period:
Values in tCO₂e, 2023/2024 crop year.
A distinction is worth making: ephemeral carbon is an annual flow of temporary carbon — it is not part of the verified GHG balance in Part 1, and should not be read as permanent sequestration. It is presented separately precisely to make clear what is a stock measurement and what is a flow reading.
A note on the scope of this calculation — and it reinforces the conservative nature of the number. Only two things entered the ephemeral carbon: what becomes product and leaves the farm (the soybean grain and the body mass of the cattle) and what humifies in the soil, tending to become very long-lived carbon. Left out was all the carbon held in feed reserves stored on the farm itself — corn grain, silage, sorghum and snaplage —, which can remain stored for up to two years as a food-security strategy for the herd, regardless of the weather. In other words: the temporary carbon flow effectively managed on the property is larger than what is accounted for here.
The GHG Protocol — and practically every carbon inventory in the world — accounts for soil carbon only down to 30 centimeters of depth. This yardstick is not arbitrary: it was born from the soil science of temperate climates, where organic matter is concentrated in a shallow surface layer and little carbon descends beyond it. For those soils, 30 cm captures almost the whole story.
Deep tropical soils, like those in Brazil, do not necessarily follow this pattern. That is why, at São Pedro da Mantiqueira Farm, the soil was measured down to 2 meters. We present the numbers below without closed conclusions — readers can draw their own.
Open trench at Roncador Farm, in the municipality of Querência/MT: living roots descend below 2 meters and the soil darkens gradually with depth — organic matter accumulating and carbon descending through the profile, well below the 30 cm yardstick. Photo and observation by the author.
I also speak from the experience of someone who digs. Every year I step into trenches on the farm and see, with my own eyes, living roots passing two meters of depth. I see the soil darken from top to bottom, gradually — what seems to me to be organic matter accumulating and carbon descending through the profile. Measuring has been routine for me since I was 14, and o what the trench shows is hard to ignore: there is life and carbon far below the line where we usually stop counting.
| Depth range | Stock (tCO₂eq/ha) |
|---|---|
| 0 to 30 cm — what the inventory counts | 267.08 |
| 30 to 200 cm — below the standard yardstick | 330.67 |
| 0 to 200 cm — full measured profile | 597.75 |
Soil carbon stock by depth range — Plot 20B, São Pedro da Mantiqueira Farm. Direct measurement (CHN). These values are carbon stock per area (tCO₂eq/ha), a quantity distinct from the annual flow balance (tCO₂e) presented in Parts 1 and 2.
In this plot, the layer between 30 cm and 2 meters holds 330.67 tCO₂eq/ha — more than the 267.08 in the first 30 centimeters. In other words: the standard yardstick would see little less than half of the carbon present in the measured profile.
What the numbers raise is a legitimate question: if there is so much carbon below the line we usually measure, how much of the soil’s role in the climate may be left out of the accounting? Confirming whether this deep carbon is also increasing under good management is the next step of the investigation.
Two readings come out of this work. The first is about São Pedro da Mantiqueira Farm: even by the most conservative and standardized yardstick in the world, and without counting deep carbon, the farm is already carbon-negative. It is part of the solution, not the problem.
The second is an invitation to investigate. The way we measure soil carbon — stopping at 30 centimeters — was a convention inherited from shallow, temperate-climate soils. Mantiqueira’s data suggest that, in deep tropical soils, this convention may be leaving a relevant part of the story out of the frame. We do not claim to have the final answer; we present the measurement and the question.
There is also a third, more personal reading. If we look at a farm as a greenhouse — a closed geographic space —, everything it removes from the atmosphere should enter the accounting, even if temporarily. In that sense, judging a property solely by its emissions, especially those of cattle, is looking at only one side of the scale: the more food a farm produces, the more carbon it pulled from the air to produce it. Accounting for all production — and all the carbon that descends and accumulates in the soil profile — may be the most honest way to measure the real role of the countryside in the climate.
Reflection by Pelerson Penido Dalla Vecchia · Grupo Roncador. The technical work — sample collection and compilation of the CHN analysis results — was conducted by SCM, and the balance verification by KPMG. The reading and hypotheses in this part are the author’s responsibility.
Greenhouse gas inventory of Agropecuária São Pedro da Mantiqueira Ltda. (Grupo Roncador), 2023/2024 crop year, prepared according to the GHG Protocol Agricultural Guidance, considering the gases CO₂, CH₄ and N₂O converted to CO₂-equivalent using the IPCC global warming potentials (AR5). Soil carbon was calculated using three approaches (Tier 2, Tier 3 and Tier 3 Metric), the latter through CHN laboratory analysis of field samples. Technical analysis conducted by SCM; independent verification of the balance by KPMG. The GHG balance is expressed in tCO₂e (annual flow); carbon stocks by depth, in tCO₂eq/ha. Ephemeral carbon represents an annual flow of temporary carbon, not a permanent stock.
The fraction of ephemeral carbon retained in livestock was estimated from a carbon mass balance of the herd (ingested carbon partitioned among respiration, methane, feces, urine and body tissue). This balance relies on NASEM — Nutrient Requirements of Beef Cattle (2016) and Dairy Cattle (2021); IPCC (2006) for enteric methane; the CNCPS system (Tedeschi, Fox & Tylutki) for nutrient partitioning; Johnson & Johnson (1995) for methane emission; and work by Ungerfeld on ruminal fermentation. The partition fractions between compartments are calibrated for the specific system. The detailed herd balance is the subject of a separate article.


